

The 40% Presidency
The nation is polarized and presidential approval is stuck


Time to check in on the state of presidential approval from a historical perspective. Trump’s numbers have dropped since January. He came into office with around a 50% approval rating, and it’s now around 42%, according to G. Elliott Morris’ average. But most of that drop occurred in his first few months in office. Since then, Trump’s numbers are hovering at roughly what they were during his first term.
Which raises an important issue that I’ve harped on before: Presidential approval just doesn’t move around like it used to. The chart below shows Gallup’s data for presidential approval going back to Harry Truman. And one thing that stands out is that approval used to fluctuate a lot more than it has since Obama took office.
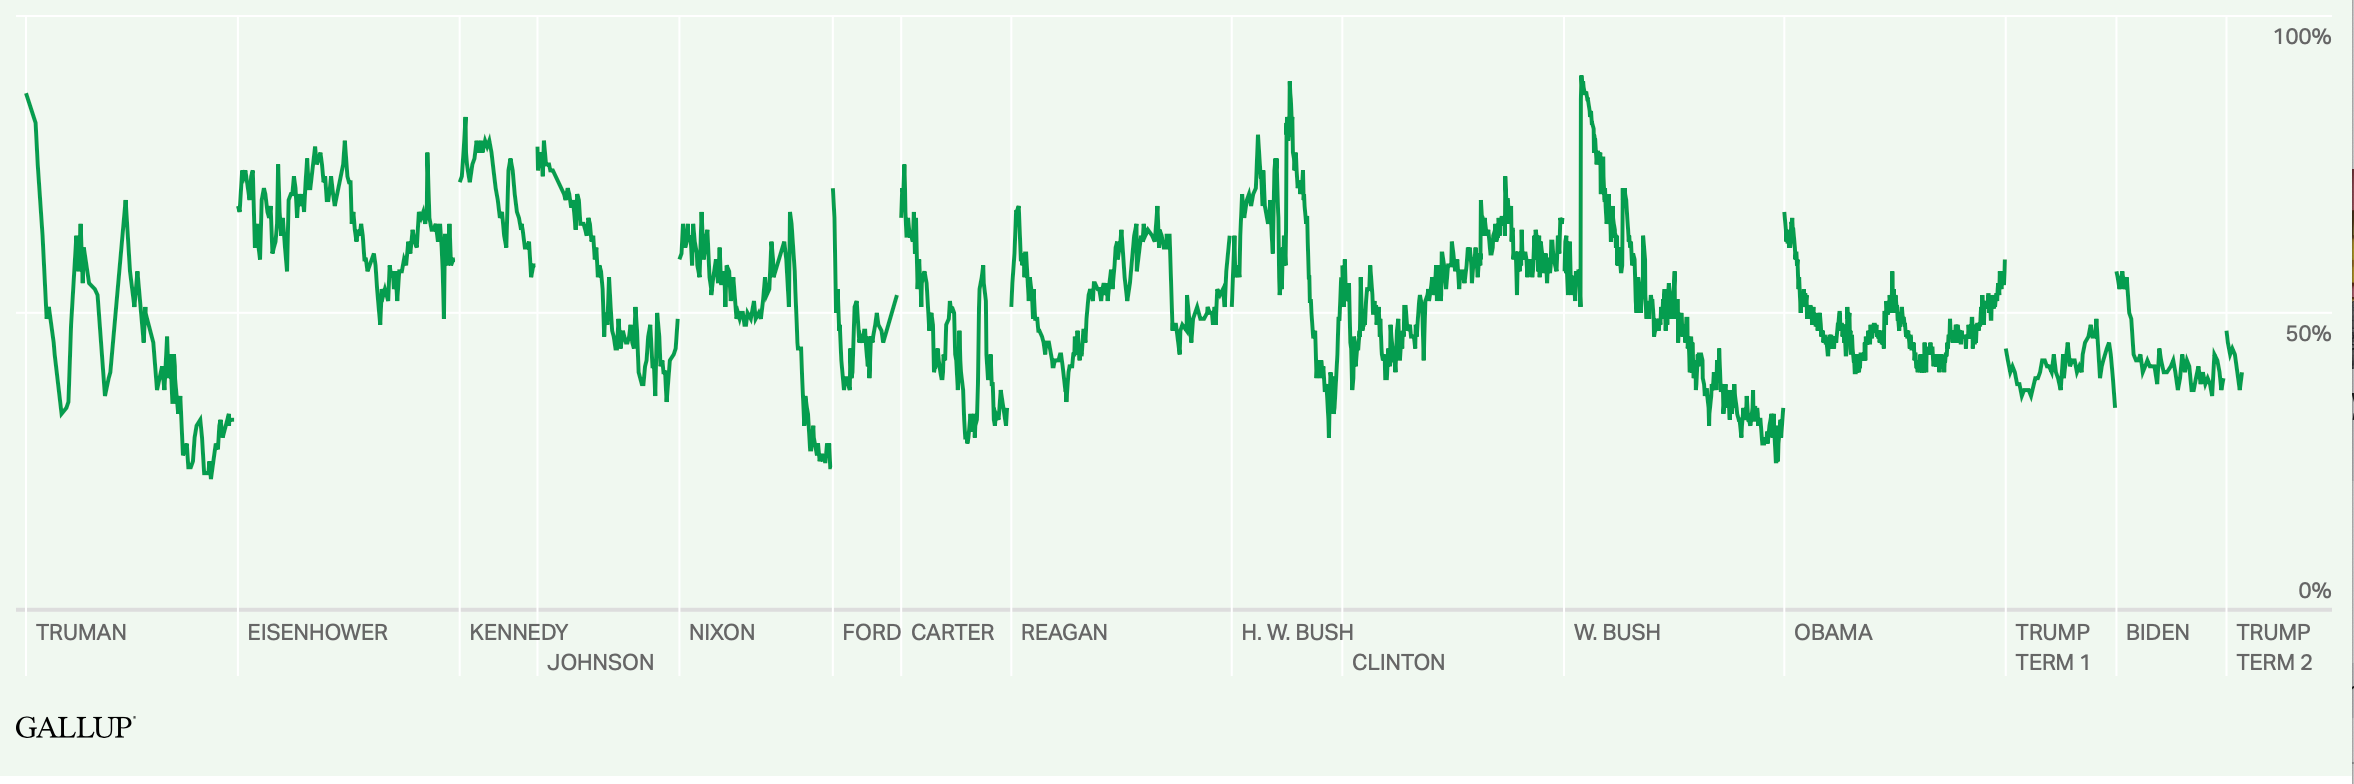
As John Sides and Robert Griffin have demonstrated, there was a strong correlation between presidential approval and economic performance from the presidencies of John F. Kennedy through George W. Bush. That’s just no longer the case.
The chart below tracks two important indicators — presidents’ monthly Gallup approval rating and the University of Michigan’s Index of Consumer Sentiment — since Obama’s presidency began. There’s obviously some variation in both, but approval ratings are pretty bracketed. No president has gotten above a 55% approval rating or below 34% since mid-2009. (George W. Bush well exceeded both those boundaries.)
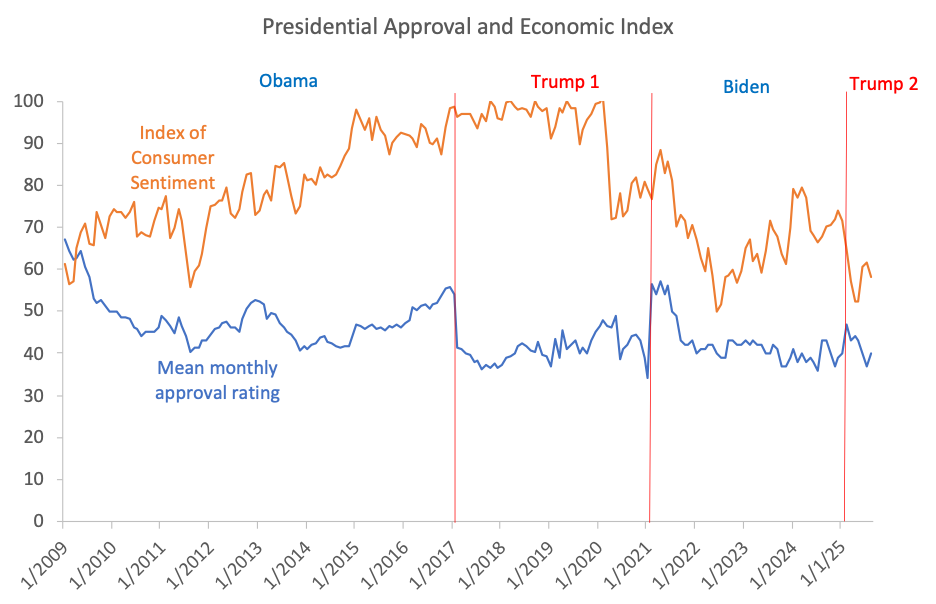
But more importantly, approval ratings appear unrelated to variations in the economic index. During the Obama presidency, the economy was strongest toward the end, but he was at his most popular at the beginning. Trump’s first-term economic figures were strong until the Covid crash, but that barely budged his approval ratings. Biden presided over a drop in economic sentiment and in approval ratings, but then the economy recovered and it didn’t help him at all.
Again borrowing from Sides and Griffin’s approach, the figure below is a scatterplot of the economic index (the horizontal axis) predicting presidential approval (the vertical axis) since January of 2009. Each dot represents a month of data. We see trendlines there for Presidents Obama, Trump, and Biden. Notably, the trendlines for Obama and Trump are basically flat and even slightly negative — a good economy didn’t help their approval ratings. However, we do see a positive relationship for Biden.
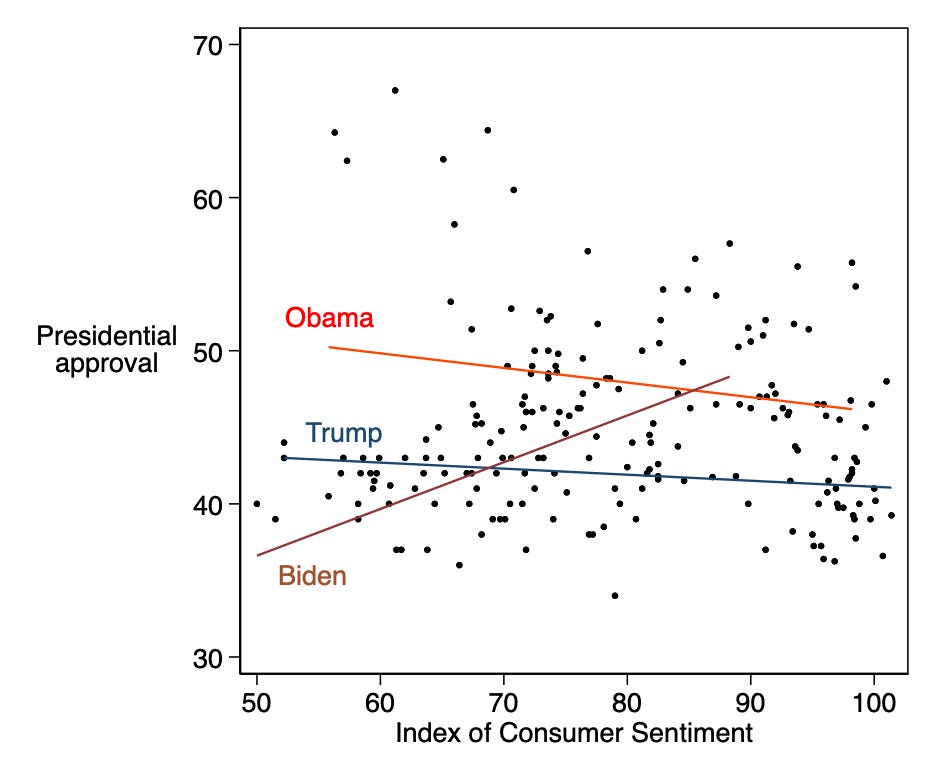
But here’s the thing: the correlation for Biden’s approval rating and his economic numbers is largely spurious. It’s driven by the Afghanistan withdrawal, which caused a sharp ten-point drop in his approval ratings at a time when economic sentiment was also dropping. The figure below looks at the same trends, only the Biden trend line omits data from 2021:
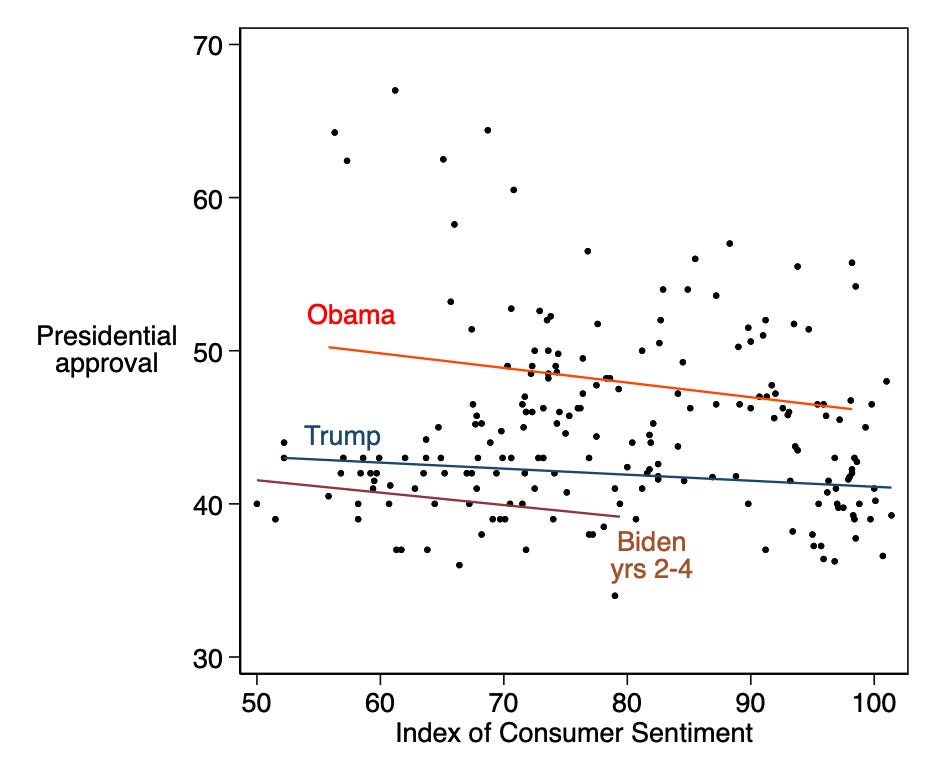
So if you take out Biden’s first year in office, his pattern looks just like Obama’s and Trump’s — no relationship between the economy and approval, and maybe even a slight downward tilt.
Trump’s second term, meanwhile, looks to be more of the same. He’s hovering right around 40% again, roughly as he did in his first term, even while the economic figures are far worse in his second term than they were in his first.
There are a few explanations for this, and it’s possible more than one is true:
Voters no longer care about economics (at least politically) as much as they care about identity. Regardless of whether Trump’s (or Biden’s or Obama’s) policies are helping or hurting voters’ wallets, they care about how that president is making them feel about themselves and the people they love and hate.
The electorate has become so polarized that partisans just always approve of their party’s president and will never approve of the other party’s president.
We just haven’t seen how voters react to a serious economic downturn or boom in a long time. The last time we had a sustained recession was in 2007-09 — almost two decades ago. The Covid era was chaotic but economic dislocation and recovery ended fairly quickly. It’s plausible that a serious downturn (or a major boom) would unmoor presidential approval from 40%. (We may get a test of this — the labor market is slowing — but we’re not in a recession now.)
Now, that doesn’t mean that nothing is happening in presidential approval. Jonathan Bernstein noted the other day something pretty stunning: Roughly twice as many Americans (46%) strongly disapprove of Trump than strongly approve of him (24%). That strikes me as important. It doesn’t signal that Trump’s approval is about to tank, but it does suggest that his hardcore supporters do not encompass half the country and that politicians backing Trump need to keep in mind the backlash they could get from energized and angry voters.
But beyond that, the overall numbers just aren’t moving much.
It's pretty simple - Trumpism is a cult based on white supremacy.
25-30% of Americans love Trump. The other 15-20% who more or less give him a pass aren’t paying attention because as bad as things are, nothing has dramatically changed in their day to day lived experiences (compared to 8 months ago) to the point where they’d start really feeling how much things in this country suck. If you still have a job and you’re not paying much attention to the political news, you might not yet be noticing how downhill the American experiment is going…yet.