Whatever's driving presidential popularity ain't the economy
Presidential approval is pretty stable and untethered from economic performance
It’s time for us to address an inconvenient truth: we don’t have a good understanding of just what’s driving presidential popularity or election results anymore.
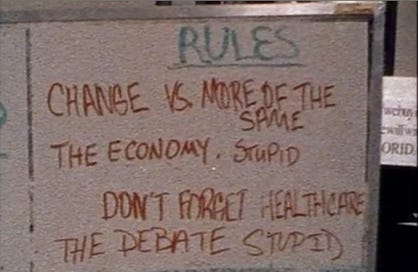
A lot of political science and punditry on US presidential popularity has tended to take some form of “the economy, stupid” — when the economy is growing, voters like the president and his party, and when it’s shrinking, they don’t. And that was a good description of the politics of the second half of the 20th century. As John Sides and Robert Griffin have demonstrated, there was a strong correlation between presidential approval and economic performance from the presidencies of John F. Kennedy through George W. Bush.
But this correlation has essentially vanished during the past three presidents. I wrote about this previously here, but now with President Biden’s term nearly complete, I wanted to revisit this issue and see how the data were shaping up.
The figure below tracks two important indicators — presidents’ monthly Gallup approval rating and the University of Michigan’s Index of Consumer Sentiment — since Obama’s presidency began. There’s obviously some important variation in both, but approval ratings are fairly bracketed. No president has gotten above a 55% approval rating or below 34% since mid-2009. George W. Bush, by contrast, substantially exceeded both those highs and lows during his presidency, and it was common for 20th century presidents to have both very strong approval periods and very strong disapproval periods, as well.
But more importantly, the approval ratings in the figure above appear unrelated to variations in the economic index. During the Obama presidency, the economy was strongest toward the end, but he was at his most popular at the beginning. Trump’s economic figures were strong until the Covid crash, but that barely budged his approval ratings. Biden presided over a drop in economic sentiment and in approval ratings, but the economic recovery since then hasn’t really buoyed his numbers.
Again borrowing from Sides and Griffin’s approach, the figure below is a scatterplot of the economic index (the horizontal axis) predicting presidential approval (the vertical axis) since January of 2009. Each dot represents a month of data. We see trendlines there for Presidents Obama, Trump, and Biden. Notably, the trendlines for Obama and Trump are basically flat and even slightly negative — a good economy didn’t help their approval ratings. However, we do see a positive relationship for Biden.
But here’s the thing: the correlation for Biden’s approval rating and his economic numbers is largely spurious. It’s driven by the Afghanistan withdrawal, which caused a sharp ten-point drop in his approval ratings at a time when economic sentiment was also dropping. The figure below looks at the same trends, only the Biden trend line omits data for 2021:
So if you take out Biden’s first year in office, his pattern looks just like Obama’s and Trump’s — no relationship between the economy and approval, and maybe even a slight downward tilt.
Now, when this was just about Obama, we could construct some stories about how his was an unusual presidency, that he was elected by a wide margin in a relatively positive election during a time of economic chaos. Then when this was about Trump and Obama we could say that these two presidencies were unusually focused on identity rather than economic performance. But three presidencies… starts to look like the new normal.
It may just be that the electorate has become so polarized that no president is going to be particularly popular or unpopular anymore — people in their party will always approve of them, and people outside it never will. We still need to come up with some explanation for why Obama’s mean approval rating was several points higher than Trump’s, which was slightly higher than Biden’s. (Please tell me this isn’t just measuring age.)
But this raises a key question of whether economic performance still determines who wins presidential elections. The economic forecast models have come pretty close in recent election cycles, but for the most part, they’ve been using pretty average growth rates of around 2-3 percent to predict what are essentially ties. 2020 was either the best or worst economy ever and was sometimes both at the same time, but again, it produced a near tie. This year, we again have about 2 percent growth and will likely have a very close election, but that doesn’t mean that the economy is causing the vote. We’re just in an era of modest growth and close elections.
So if we’re still wondering when the recovering economy and reduced inflation are going to help Biden’s popularity or boost Kamala Harris’ election chances — they aren’t.


Polarization and inequality go hand in hand.
Were credit card debt, auto repossesions/purchases and other measures of actual consumer welfare considered?