

Did Dems do better everywhere?
Their nominees were good, but they largely just benefited from a national swing in their party's direction


What was the key to Democratic electoral successes last week? Were they just really smart about nominating good candidates who focused on particular aspects of economic distress and connected with state voters? Did they just benefit from an overall swing against Trump? Did they perform better in some places than they did in others? At least a first cut at this suggests that there was a nationwide swing that lifted all Democratic boats.
I looked at all the county-level votes for the Democratic gubernatorial candidates in New Jersey and Virginia, and I compared those with the county-level votes for Kamala Harris in 2024. Yes, this is only two mid-Atlantic states1, but this approach has the advantage of looking at a very wide ideological range of counties. It includes, for example, Lee County, Virginia, where Kamala Harris won 14% of the vote last year, as well as Essex County, New Jersey, where she won 73% of the vote.
New Jersey has 21 counties, and Virginia is divided into 133 counties and cities, for a total of 154 localities. In the figure below, each dot is a county, with hollow dots representing New Jersey and solid dots Virginia. The horizontal axis charts the 2024 vote for Kamala Harris, and the vertical is the vote for the Democratic gubernatorial candidate last week.2 The red line is just the 2024 presidential vote, so if a dot is above the line, that means the Democratic vote in 2025 was greater than in 2024.
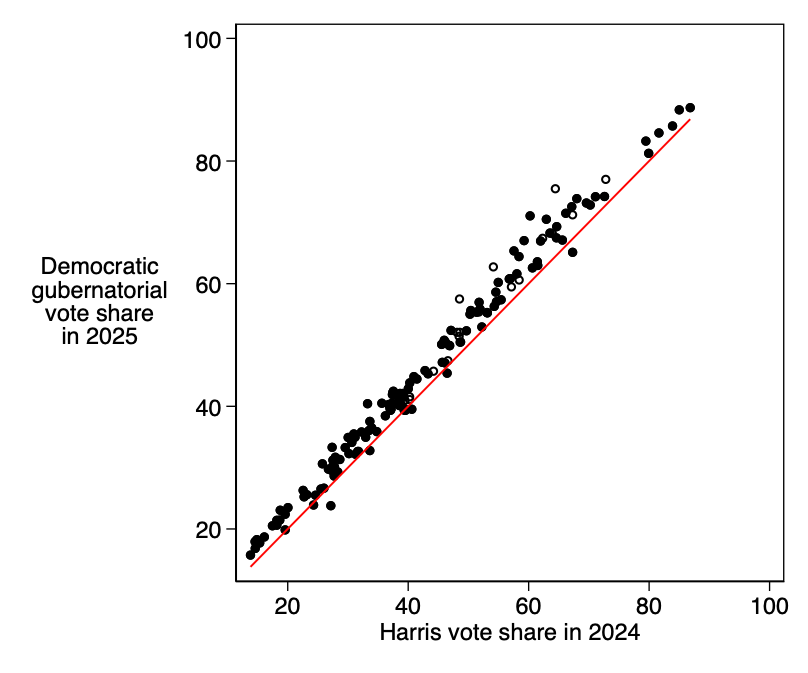
A few observations here:
That’s a very consistent swing. The correlation of these two variables is .99. There’s very little variation to study.
On average, the Democrat did just over 3 points better at the county level in 2025 than Harris did in 2024. That was a 3.6-point shift in New Jersey and a 3-point shift in Virginia. (The county-level vote can be somewhat misleading since county populations vary widely. At the statewide level in New Jersey, for example, Harris won by 6 points last year, and Mikie Sherrill won by 14.)
There are almost no points below the line. The Democratic vote share went up in 147 of 154 localities.
In 2024, neither New Jersey nor Virginia were targeted by either presidential campaign, whereas the gubernatorial candidates aggressively campaigned there this year and focused on particular areas of strength and competitive regions. It’s hard to see that in the election results, though, where it just looks like a uniform swing.
Now, while there wasn’t a ton of variation in the Democratic vote swing, there was a bit. In the plot below, we can see the increase in the Democratic vote share from 2024 to 2025, plotted against the Harris vote share in 2024. What this shows is that Democrats had slightly greater improvement in more Democratic localities. In the most conservative areas, Democratic vote shares rose by around 2 points, while they rose by 4 in the most liberal areas. That difference is statistically significant, although not particularly huge.
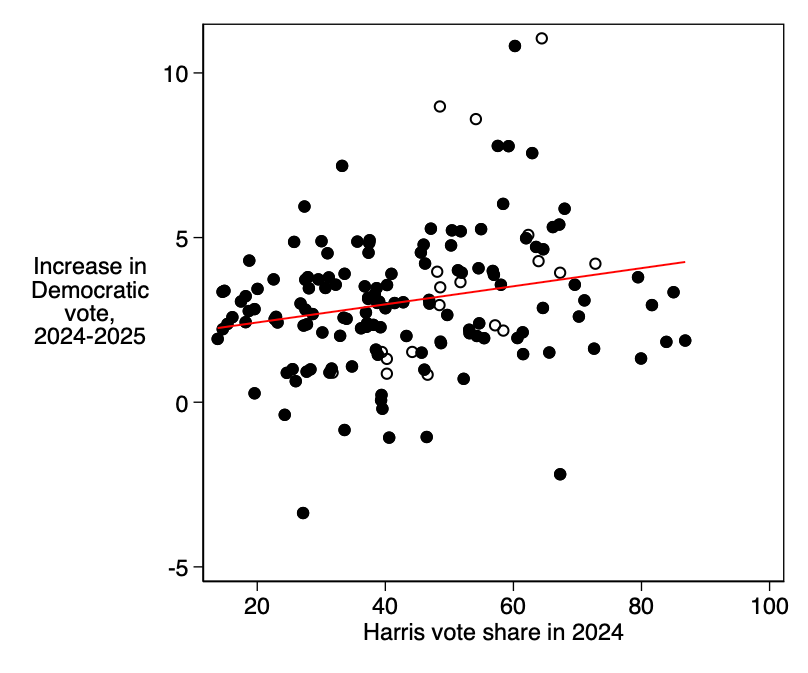
Again, this is just a first look. It would be helpful to get a sense of which localities saw the most campaign activity, or which saw the greatest difference between Democratic and Republican activity. But as I noted above, there’s not a ton of variance to explain. This all suggests a uniform swing in the Democratic direction, and Sherrill and Spanberger were fortunate to be their party’s nominees when that happened.
However, I’ll note another important datapoint: the Virginia Attorney General’s race. In that, a scandal tainted Democratic nominee, Jay Jones, defeated the Republican candidate by about five points. Jones won, but did almost ten points worse than Abigail Spanberger, suggesting that candidate behavior and quality may matter a great deal.
So I’m leaving you nowhere. Is it the candidate or the conditions? Yes.
Democratic-leaning candidates did well across the country, even if direct comparison to previous elections is challenging. Progressives took control of the (non-partisan) city council in Aurora, Colorado, for example.
For all measures I used the Democrat’s share of the two-party vote.
Great post, SM. My dad was a rehabilitation psychologist and, intellectually, an eclecticist. He introduced me to multifactorial causality and also to the notion that, in therapy, "Everything works for somebody, and nothing works for everyone."
So, I agree with your "Yes" to candidates and their conditions/political environment, and I add a"Yes" to a million other little variables that cut every which way. In this case, the net of all these variables was a D victory, in multiple locations and various circumstances. That victory was small in some places, large in others. Definitely significant in the statistical sense, but still new and unsettled in its long-term political effects.
It might be interesting to add as an addendum graphs that indicate the slope for each of the two states, as well as "in the aggregate" that you display. An interesting post and as a now-Virginia resident, it squares with my "on the foot" perspective of bouncing here to there changing politics in VA.