


Where Harris did better and worse in Colorado
Counties with more Latinos swung further rightward

In the postmortems from the 2024 presidential election, several political observers have noted that Colorado was one of the few bright lights in an otherwise pretty dark night for Democrats. The vote didn’t swing much in Republicans’ direction (Harris won the state by 11 points; Biden had won it by 13 in 2020), and Democrats maintained their strong hold over the state legislature and defeated nearly all conservative-leaning initiatives. But if you dig into the state, it turns out some parts of it swung right while other parts swung left. And the best explanation is how many Latinos there are in an area.
Below is a map of Colorado’s 64 counties. In 35 of those counties (shaded in red), Harris did worse than Biden did four years earlier; in the remaining 29 (shaded in blue), Harris did better than Biden. The margins range from Costilla County, where Harris did 6.3 points worse than Biden, to San Juan County, where she did 3.8 points better.
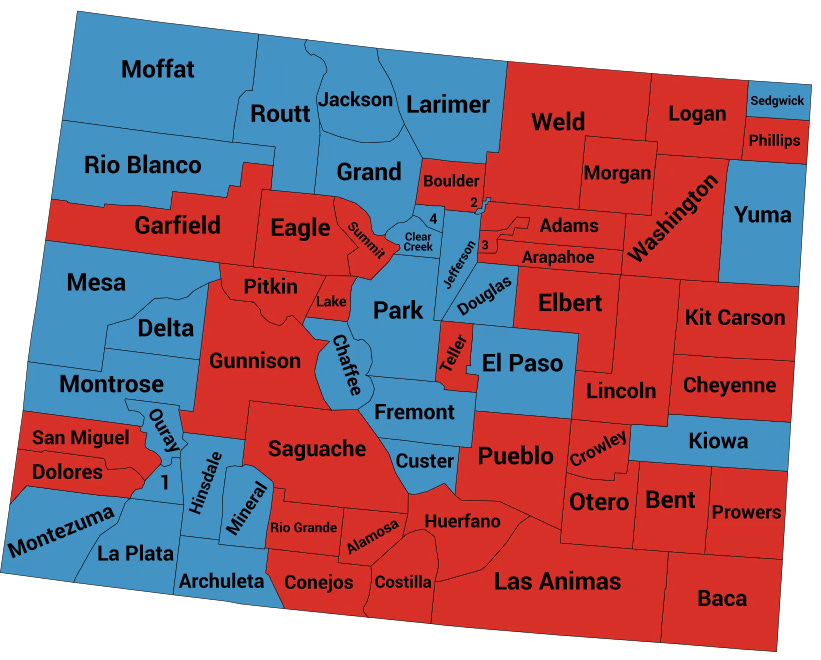
There is some sort of geographic pattern there, with Harris doing relatively well in the Denver suburbs and the western counties (Denver is the small central county indicated by the number 3), but it’s not immediately obvious what is driving this.
I examined a few different county-level demographic indicators, and it looks like the most reliable predictor of whether a county swung toward the Republican ticket in 2024 is the percentage of Latino residents it contains. Below is a scatterplot comparing the percent of the county that is Latino against the rise in the Democratic vote share between 2020 and 2024. I’ve highlighted a few of the counties. As can be seen, there is a strong negative relationship between these two variables. The more Latinos, the worse Harris did relative to Biden.

Below is a multivariate regression showing the influence of several different variables on the rise in the Democratic vote share at the county level. I’ve used the Democratic vote share in 2020, the population size, the percent Latino, the percent Black, the percent foreign-born, median income, and the percent with a college education to predict the Democratic rise in the vote between 2020 and 2024. The percent foreign-born is on the edge of statistical significance but isn’t quite as strong a predictor as the percent Latino. None of the rest are statistically significant.
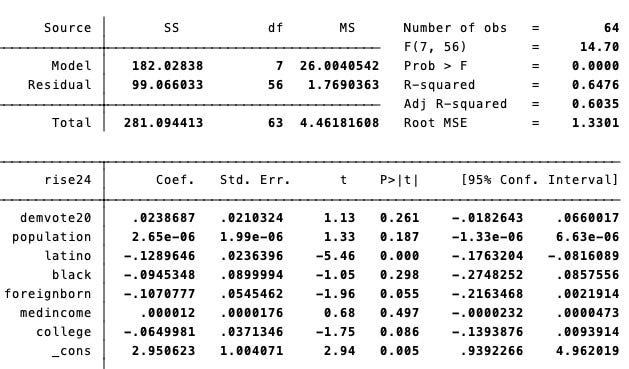
Now, we should keep in mind that this analysis has what’s called an ecological inference problem. That is, I’m using county-level data to make inferences about how individual voters behaved. But the results above are consistent with what we’ve seen from national exit polls — Latinos generally swung rightward across the country, and thus places with more Latinos saw more of a rightward shift.
This is an interesting tell in a state where the presidential campaign was largely absent. For what it’s worth, the western half of the state is largely in the third congressional district, a Republican-leaning district that nonetheless saw a strong Democratic performance by congressional candidate Adam Frisch, who lost to Republican Jeff Hurd by about three points. It is at least plausible that some of the Democratic strength relative to 2020 is due to Frisch’s campaigning. On the other hand, there was a fierce campaign in the 8th congressional district, containing portions of Adams, Larimer, and Weld counties, where Harris didn’t do a whole lot better than Biden. So this could be in part a campaign story, but the demographic story is a pretty compelling one, and is consistent with what we’ve seen elsewhere.
Update: Data available here.